Many of you asked how I made the CER poster that was shared at today’s staff meeting. If you are interested, the website is www.piktochart.com. The website is quick to learn. When you begin your first document, the website walks you through the basic steps. After that, it has a menu driven editing tool similar to what is used in Microsoft/Google Document editors.
How could you use this tool to bring 21st Century Learning to your classroom?
Teachers could create (or search for) infographics that:
Students could create Infographics that:
What Next?
If you want to learning more, Piktochart has a wonderful Q&A page with many links, including:
How can I make an Infographic in Five Steps?
How could you use this tool to bring 21st Century Learning to your classroom?
Teachers could create (or search for) infographics that:
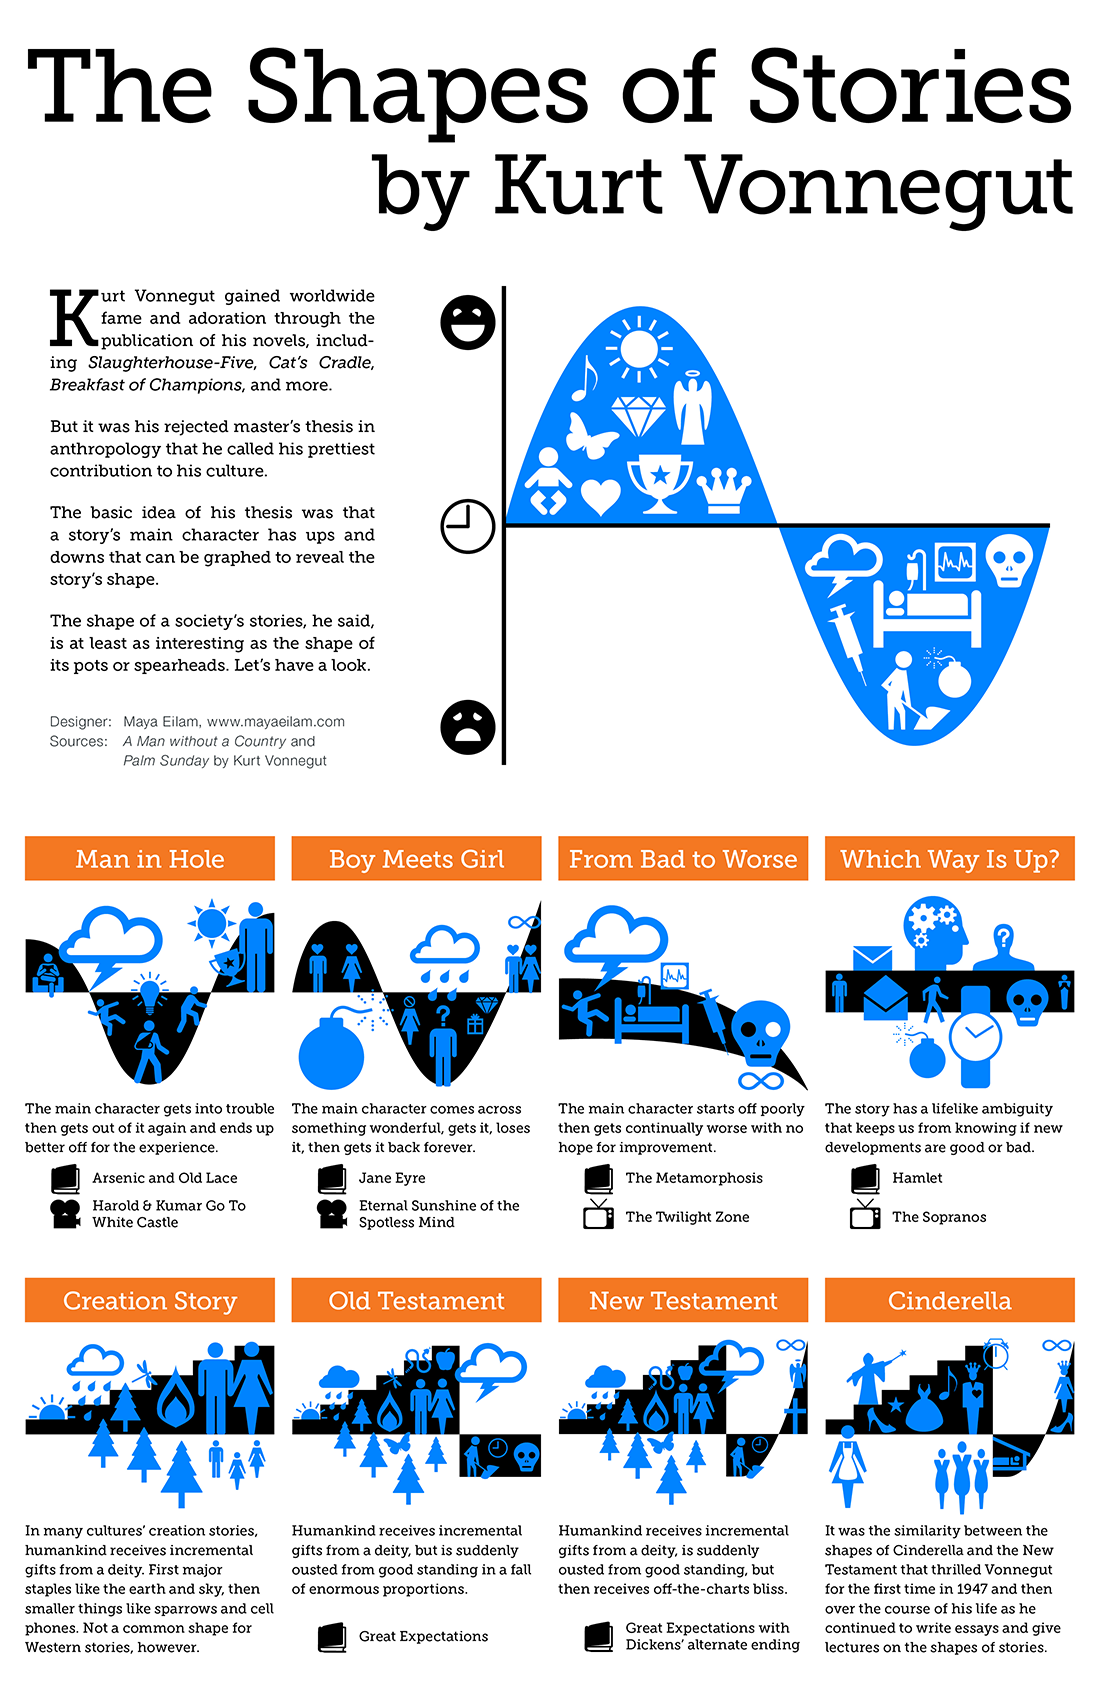
- Math! Present complex information in a visual (and cross-curricular) way.
- Language Arts! Create anchor charts to visually remind students of key information from current and past reading/writing workshops.
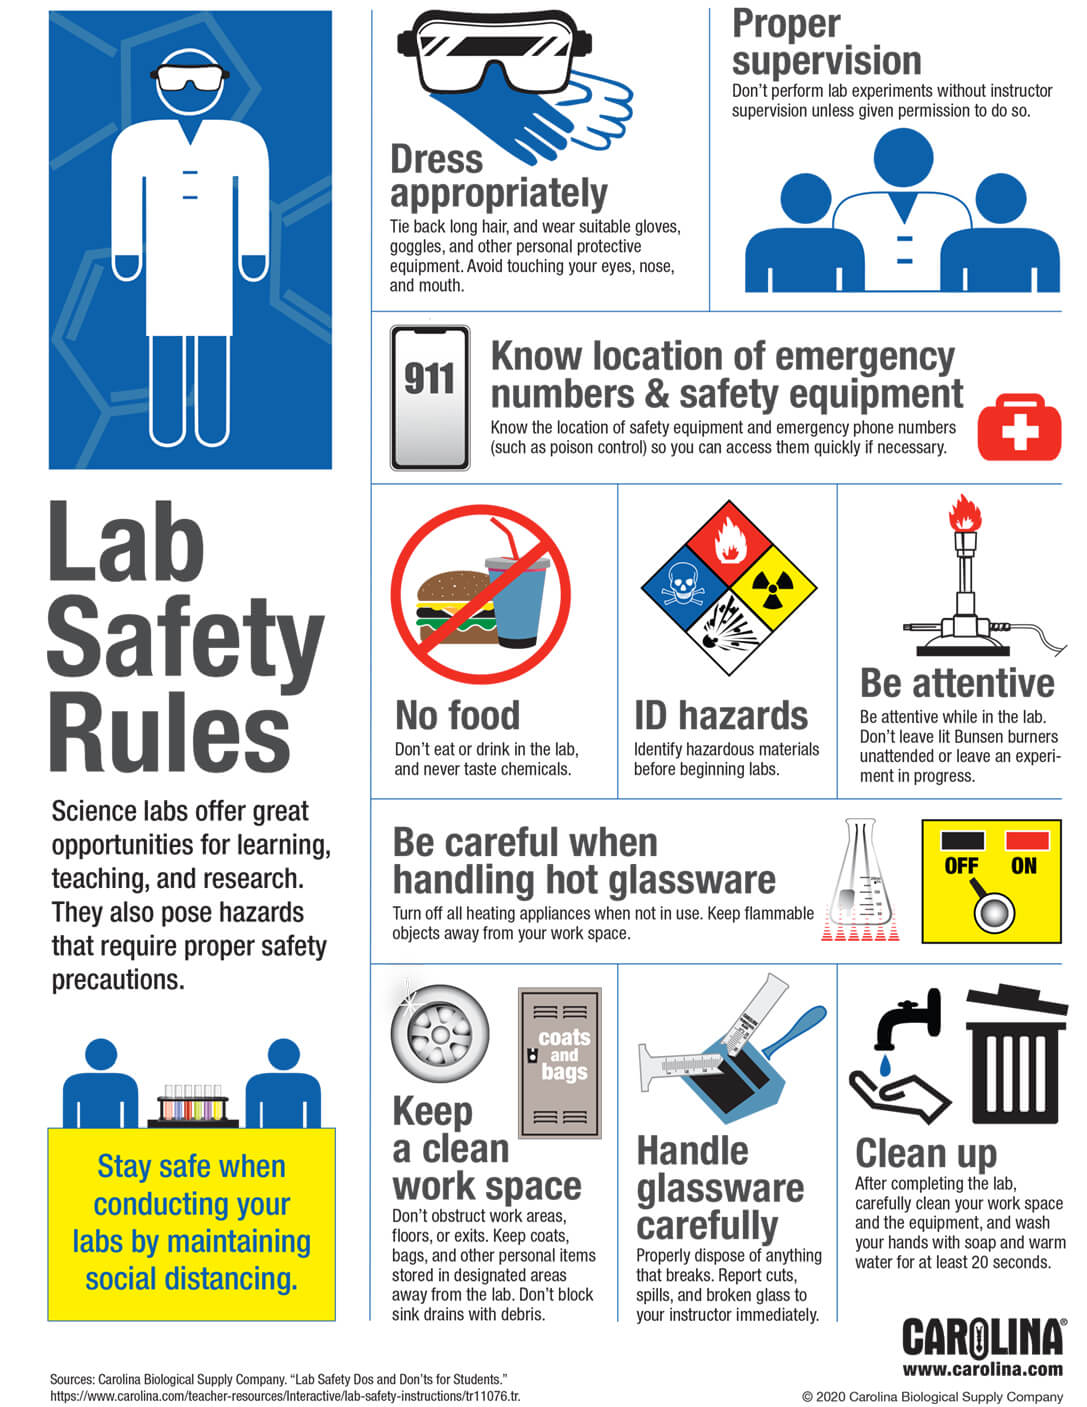
- Science! Display lab safety rules or teach a scientific law (and maybe German too!).
- Social Studies! Simplify big issues like Voting Trends, World Population, and the Cat Problem.
- Anyone! Document and celebrate a class success. Build a survey, collect data, share it back with the class. Or better yet, have the kids do this!
Students could create Infographics that:
- Math! Conduct statistical research and create an Infographic that displays uncovered statistical information using images.
- Language Arts! Create a poster in which your students retell their history as a reader or have students research and explain grammar rules then decorate your classroom.
- Science! Create visual reports by researching a natural disaster. Capture and report back the statistics using numbers, words, maps, and charts.
- Social Studies! Create presentations that analyze the Pro & Con stance on a social issues by including researched facts, statistics, and maps. Bring it home by including pictures of how the issue reveals itself in Camas and video interviews with community members.
What Next?
If you want to learning more, Piktochart has a wonderful Q&A page with many links, including:
How can I make an Infographic in Five Steps?


 RSS Feed
